


7 Features Government Fleets Actually Need in Fleet Management Software
Key Takeaways
- Most dashboard guides list KPIs. Almost none explain which ones to ignore when your fleet is under 100 vehicles.
- The categories that matter: cost, utilization, maintenance health, safety, and ops throughput.
- Tracking 10–15 well-chosen fleet reporting metrics beats tracking 40 poorly understood ones.
- Your dashboard is only as useful as the data feeding it, a reminder that most fleets still fight every day.
- The step most teams skip: defining what 'good' looks like before they start tracking.
When I was researching this topic, the thing I couldn't find anywhere was a guide that distinguishes between the KPIs that help you run a fleet and the ones that just look impressive in a board deck. Most guides cover the full metrics list. None of them cover what happens when you try to act on it.
So that's what this guide does. Not just what to track, but what those numbers actually tell you, and when they stop being useful.
What Is a Fleet Management Dashboard, and What It Isn't
A fleet management dashboard is a centralized view of real-time operational data: vehicles, drivers, costs, maintenance status, and performance trends, organized so you can act on them without digging through spreadsheets or calling four people.
What it isn't: a reporting tool you check once a month. The fleets that get real value from dashboards use them the same way a mechanic uses a diagnostic scan, not to generate a report, but to answer a specific question right now. For a deeper look at how fleet reporting software fits into this, that guide is worth reading alongside this one.
In conversations with fleet managers across construction, healthcare, and logistics, the pattern we see most often isn't that they lack data. It's that they have too much data organized in a way that doesn't answer the question they're standing in front of. This is exactly what misleading fleet reports look like in practice, and why structure matters as much as the metrics themselves.
A well-structured dashboard solves that problem. It doesn't replace judgment, it removes the part of the process where judgment gets replaced by guessing.
The 5 Categories of Fleet KPIs Worth Tracking
Every KPI worth tracking falls into one of five categories. If a metric doesn't fit cleanly into one of these, it's probably vanity data.
1. Cost KPIs: Understanding Profitability
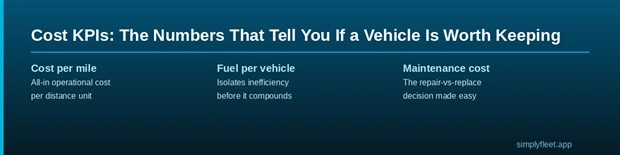
Cost per mile/km. This is the number most fleet managers say they track and fewer actually do. It combines fuel, maintenance, overheads, and depreciation into a single figure that answers: is this vehicle earning its keep? The insight isn't the number itself, it's the trend. For a structured approach to this, calculating total cost of ownership gives you the right framework.
Fuel cost per vehicle. Monitoring fuel consumption per vehicle, not just total fleet fuel spend, is where the useful signal lives. One vehicle burning 20% more than comparable vehicles is worth investigating. It could be driver behavior, a maintenance issue, or route assignment. You won't see it looking at fleet-wide totals.
Maintenance cost per vehicle. This metric supports the repair-vs-replace decision. Fleets that track spend by vehicle over time have the data to make that call confidently. See also: hidden fleet maintenance costs for what this pattern typically looks like when it isn't tracked.
2. Utilization KPIs: Measuring Efficiency
Vehicle utilization rate (%). The fleet utilization rate guide covers benchmarks in detail, but generally, anything below 60–65% sustained utilization is worth examining. That said, low utilization isn't automatically a problem; context is everything.
Idle time (%). Untracked idle time is one of the quieter cost leaks in fleet operations. Fuel burns during idle. Wear accumulates. Tracking idle time by driver, by vehicle, and by time of day starts to reveal the patterns.
Trips per vehicle per day. A useful counterbalance to utilization rate, a vehicle can have high utilization but low trip count (long haul) or low utilization but high trip count (short urban runs). See our deeper dive on downtime KPIs for fleets for how to read these two metrics together.
3. Maintenance KPIs: Ensuring Fleet Health
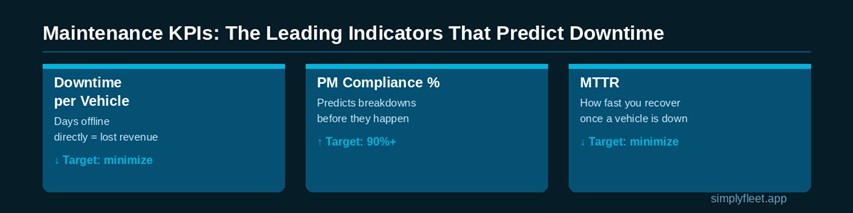
Downtime per vehicle: Every day a vehicle is out of service costs money and disrupts scheduling. Tracking fleet downtime and uptime per vehicle over time shows whether your maintenance program is preventing breakdowns or just responding to them.
The data on reactive vs preventive maintenance isn't ambiguous. Fleets that run reactive maintenance consistently spend more, not less, than fleets with structured PM programs. The problem is that switching takes organizational will, not just a software purchase.
Preventive maintenance compliance (%): The leading indicator that most dashboards bury in a sub-menu. PM compliance predicts future downtime before it arrives. If you're building a preventive maintenance program from scratch, start there before you instrument this metric.
Mean Time to Repair (MTTR): Once a vehicle is down, how quickly does it come back? Improving MTTR requires understanding where delays actually occur: waiting for parts, technician availability, or authorization. Our post on why fleets still break down despite having PM programs covers the most common culprits.
4. Safety KPIs: Strengthening Risk Control
Accident rate. Total accidents doesn't tell you much. Accidents per 100,000 miles lets you compare across vehicles with different usage patterns. Your fleet safety plan should specify which format you use, and make it consistent.
Driver behavior score. Speeding, hard braking, rapid acceleration, each has a direct relationship with both accident risk and maintenance cost. Tracking driver behavior scores by driver creates the basis for coaching conversations before something goes wrong. See: how to address driver behavior concerns.
Incidents per distance traveled. Normalizing incidents by distance is the step most fleet safety reports skip. It makes safety data comparable across fleets of very different sizes, a 5-vehicle fleet and a 50-vehicle operation can't compare raw incident counts meaningfully, but they can compare incidents per 100,000 miles.
5. Operational KPIs: Improving Performance
On-time delivery/service rate (%). Vehicle issues, driver behavior, and maintenance failures all show up here before they show up anywhere else. Track it as a fleet-level metric, not just a logistics metric.
Route efficiency. Planned distance versus actual distance traveled. The gap between those two numbers is money, fuel, time, and wear. Persistent gaps on specific routes often reveal local knowledge that hasn't been codified into route planning.
Deliveries per vehicle. When two similar vehicles are running similar routes but producing different delivery counts, something is worth investigating. The metric doesn't tell you which, it tells you where to look. How fleet data improves cost forecasting connects this KPI directly to budget planning.
What a Well-Designed Fleet Dashboard Looks Like
Structure matters as much as content. For small fleets especially, complexity is a usability tax that doesn't pay off.
The 'Trends' section is the most important one, and it's almost always the least-used. Fleet managers check the snapshot. They rarely look at trends unless they're already in problem-solving mode. The dashboards that actually change behavior surface trend alerts automatically, flagging vehicles whose maintenance costs are trending up month over month. This is where AI fleet management tooling has started to close the gap: automated anomaly detection rather than waiting for someone to notice.
Fleet Management KPI Quick Reference Table
Use this table when deciding what to include in your initial dashboard build. Prioritize rows that map directly to decisions you make weekly. The fleet reporting metrics guide and fleet data metrics and benefits post are useful companions to this table.
Download Our Free Fleet Management Resources Now!
Prevent costly breakdowns and maximize uptime with our free checklist.
Download
How to Build an Effective Fleet Dashboard
The step that's missing from almost every guide on this topic: before deciding what to track, decide what decisions the dashboard needs to support. The fleet reporting best practices post frames this well, start with the decision, not the metric.
Start with 10–15 KPIs, not 40
Every KPI you add to a dashboard requires someone to understand it, monitor it, and act on it. Start with the minimum set that covers cost, utilization, maintenance health, and safety, and add only when there's a clear operational reason to do so.
Set benchmarks before you start tracking
A metric without a target is just a number. Before your dashboard goes live, define what 'good' looks like for each KPI. If you're transitioning from manual tracking, use your spreadsheet history as the baseline.
Use real-time data where it changes decisions
Maintenance cost trends are fine as weekly snapshots. But vehicle availability, which vehicles are currently down, needs to be live if it's going to support dispatch decisions. Build your refresh frequency around the decisions each metric supports.
Design for the person who will use it daily
Most dashboards are designed for executive review. The people who need them most are the ones managing operations at 7 am. Simple layouts, clear color indicators for out-of-range values, and most-needed metrics front and center. If your dashboard requires training to use, it won't be used. This is also why fleet management software complexity is one of the most common reasons dashboards go unused.
Common Mistakes Worth Avoiding
Most guides cover what to do. Here's what the teams that get this wrong actually do:
- Tracking too many KPIs without a clear owner for each one. Accountability per metric matters as much as the metric itself.
- Building the dashboard before cleaning the data. If your maintenance records are incomplete or mileage data is inconsistent, your dashboard will surface noise, not signal.
- Setting up dashboards and reviewing them monthly. Monitoring fleet performance in real time is the operational rhythm that makes dashboards useful. A monthly review is just a report.
- Optimizing for presentation over decision-making. When in doubt, optimize for: 'do I need to act on anything right now?' Misleading fleet reports identify how dashboard design actively obscures what the data is saying.
- Replicating the old spreadsheet structure in new software. Teams that move from spreadsheets to fleet management software often carry their old reporting logic over. That's a missed opportunity; the software can surface patterns the spreadsheet never could.
Final Thoughts
A fleet management dashboard done well is a decision-support tool. For a broader view of where this fits in your reporting stack, the fleet data analysis and reporting guide covers the full picture.
The fleets that get this right are clear on what decisions the dashboard needs to support before they build it. If you want a shortcut, 7 crucial KPIs to improve your fleet management process is a practical starting point for that prioritization conversation.
Cost control in fleet is treated as a finance problem. It's a data problem. Teams that track the right things cut costs without specifically trying to, because the tracking changes behavior before the cost ever shows up.
Simply Fleet gives you the dashboard infrastructure without enterprise software complexity. Track repairs, automate maintenance reminders, monitor vehicle health, and pull the KPIs that matter, without needing a dedicated IT team. Not sure if the investment makes sense yet? The fleet software ROI calculator runs the numbers for your fleet size.

.webp)


