


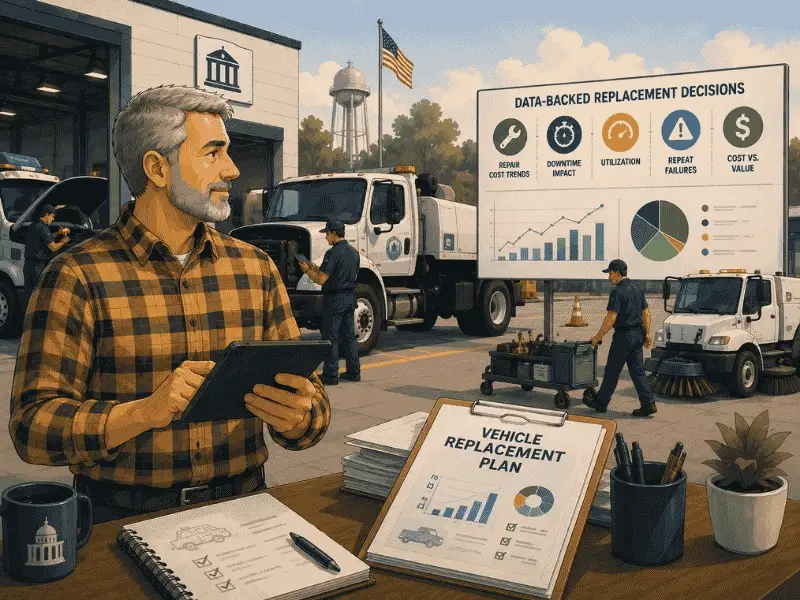
How Municipal Fleets Build a Data-Backed Vehicle Replacement Plan
Key Takeaways
- Most fleet reports look complete but hide real risks
- Poor data quality and human behavior distort results
- Backward-looking and cluttered dashboards delay action
- Disconnected systems create blind spots
- Real reporting focuses on risk, trends, and future issues
- Better visibility starts with integrated, honest data
Fleet reports are supposed to give clarity. They should tell managers which vehicles are healthy, where money is leaking, and what risks are building. Yet many fleet leaders have the same quiet frustration: the reports look good, but the problems keep coming. Breakdowns happen unexpectedly, costs rise without warning, and compliance issues appear out of nowhere.
The truth is simple but uncomfortable - most fleet reports don’t show the real picture. They show activity, not reality. They summarize data, not risk. And they often hide problems instead of revealing them.
This gets worse as fleets grow. A 10-vehicle operation can catch a rushed inspection because the owner still looks at every truck. At 100 or 500 vehicles, nobody's looking at every truck, the report is the only visibility anyone has. That's exactly why clean numbers at scale deserve more scrutiny, not less, a mid-size or large fleet has more room for a bad habit to hide inside a good-looking average.
This article breaks down why fleet reporting fails in the real world, what’s missing from most dashboards, and how fleets can move from surface-level reporting to real operational visibility.
What Fleet Reports Are Supposed to Do
At their core, fleet reports should help answer a few critical questions:
- Are vehicles safe and roadworthy?
- Are maintenance costs under control?
- Which vehicles or drivers are creating risk?
- Where will problems appear next month, not last month?
Unfortunately, many reports only answer what happened, not what’s happening or what’s about to happen.
The Biggest Reasons Fleet Reports Miss the Real Story
Most fleet reporting problems don’t come from technology alone. They stem from how data is captured, interpreted, and connected across daily operations. These gaps quietly distort insights, delay decisions, and allow small issues to grow into costly fleet failures.
1. Poor Data Quality at the Source
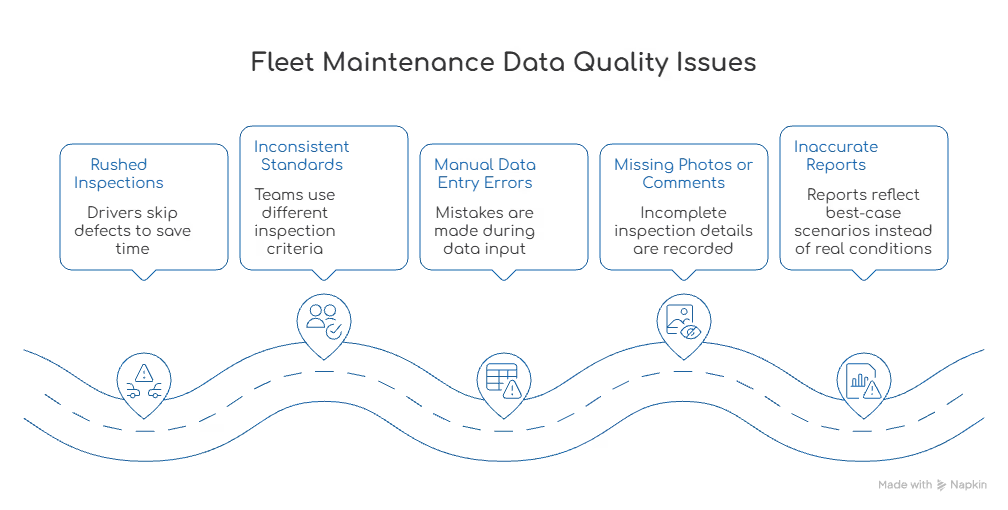
Fleet software doesn’t create truth. It reflects what people enter. If vehicle inspections are rushed, defects are skipped, or odometer readings are guessed, the report will still look complete but won’t be accurate.
Common data issues include:
- Drivers skipping minor defects to save time
- Inconsistent inspection standards across teams
- Manual data entry errors
- Missing photos or vague comments
When this happens, reports quietly turn into best-case scenarios rather than real conditions.
2. Underreporting of Issues Due to Human Behavior
Drivers and technicians are human. If reporting problems feels like admitting fault or creating extra work, issues will go unreported.
This leads to:
- “Green” inspection reports despite real wear
- Maintenance logs that look lighter than reality
- Repeated breakdowns with no early warning in reports
3. Reports Focus on Activity, Not Risk
Most fleet reports track what was done:
- Number of inspections completed
- Maintenance tasks closed
- Fuel purchased
What they often miss is risk exposure:
- Vehicles repeatedly passing inspections with comments ignored
- Maintenance tasks closed late but marked complete
- Assets showing patterns that indicate future failure
4. Backward-Looking Data Dominates Dashboards
Many reports are historical by design. They summarize last week, last month, or last quarter. That’s useful for accounting but weak for operations.
Backward-looking reports fail to show:
- Early warning signs of component failure
- Vehicles drifting out of compliance
- Maintenance schedules slowly slipping
5. Too Many Metrics, Not Enough Meaning
Fleet managers often face dashboards packed with numbers. Fuel usage, mileage, service counts, costs, downtime.
The problem isn’t lack of data. It’s lack of clarity.
When everything is tracked equally:
- Critical issues get buried
- Trends are hard to spot
- Decision-making slows down
Download Our Free Fleet Management Resources Now!
Prevent costly breakdowns and maximize uptime with our free checklist.
Download
6. Disconnected Systems Create Fragmented Reports
Many fleets use separate tools for:
- GPS and telematics
- Fuel cards
- Maintenance logs
- Inspections and compliance
When these systems don’t talk to each other, reports become fragmented. Fuel costs don’t align with mileage. Maintenance data doesn’t match inspection findings. Managers are forced to interpret gaps instead of insights. This fragmentation hides the real operational story.
7. “Clean” Reports Can Actually Signal Trouble
Ironically, the fleets with the cleanest-looking reports are often at higher risk.
Why?
- Zero defects month after month is unrealistic
- No variation often means underreporting
- Lack of issues suggests lack of scrutiny
Real fleets are messy. Honest reporting shows patterns, not perfection.
This is especially true past a few dozen vehicles. A small fleet with zero defects might just be lucky that week. A 200-vehicle fleet with zero defects almost certainly isn't, the math alone says something's being missed or not reported.
Where Fleet Reports Usually Go Wrong (At a Glance)
Why Many Fleets Don’t Realize Their Reports Are Misleading
Fleet issues often show up gradually. A late service here. A skipped inspection there. Over time, these small gaps compound into breakdowns, compliance failures, and budget overruns.
Because reports still look “normal,” problems feel sudden when they finally surface.
In reality, the warning signs were always there, just buried or disconnected.
How Simply Fleet Helps Reveal the Real Picture
If fleet reports aren’t helping prevent breakdowns, control costs, or reduce risk, it’s time for a clearer view. Simply Fleet helps turn everyday fleet data into insights that actually reflect reality so decisions are based on what’s truly happening, not just what’s reported.