


Why Geotab + Simply Fleet Is a Powerful Combination for Large Fleets
Key Takeaways
- Fleet data analysis improves decision-making by shifting focus from scattered reports to five actionable metrics: cost-per-mile, fuel efficiency, safety events, vehicle utilization, and maintenance budget.
- The F.L.E.E.T. method ensures metrics drive real outcomes through clarity, action triggers, and trend tracking.
- Pilot programs with small samples prove ROI, showing 8–15% fuel savings, 20% lower maintenance costs, and faster decision-making.
- Modern fleet management software reduces downtime, simplifies compliance, and delivers long-term efficiency and cost advantages.
The Wall of Pretty Charts That Nobody Uses
Let me tell you about Mike's office.
Walk in there and you'll see forty-seven printed reports taped to his wall. Colorful pie charts showing fuel costs. Bar graphs tracking maintenance. Line charts with driver scores that look impressive but mean nothing to anyone.
Here's the thing - nobody looks at them. Not once since that monthly meeting three weeks ago.
Mike runs his twenty-three delivery trucks the same way he always has. Gut instinct. Hallway conversations. Whoever yells the loudest when something breaks down gets the attention.
Then his insurance company shows up for its annual audit.
"What's your fleet's safety score?" the auditor asks, stylus ready on her tablet. This number will determine next year's premium rates.
Mike looks at his wall of colorful charts. Fuel efficiency by driver? Yeah, it's somewhere in spreadsheet tab 47. Accident patterns by route? That's scattered across three different systems that don't talk to each other. Which maintenance issues lead to safety problems? Nobody's ever connected those dots.
The scramble that follows costs Mike $23,000 in rushed data work. They miss the audit deadline anyway. And they still can't answer the basic question: Is this fleet getting safer or more dangerous?
I see this everywhere.
You're probably reading this because your fleet creates tons of data, but somehow you're still flying blind when decisions matter. Look, I get it. You're drowning in information but starving for insight.
Here's what nobody tells you: the best fleet analytics aren't real-time - they're right-time. Small fleets don't need enterprise software. They need enterprise thinking.
Quick test: If you could only track five numbers for the next six months, which ones would actually change your daily decisions?
Can't answer that in thirty seconds? Stick around. This is way simpler than the software vendors want you to believe.
Where Your Fleet Sits: The Four Levels of Data Maturity
Most fleet managers think they're behind on technology. Truth is, you're probably right where everyone else is. Let me show you the four levels every fleet goes through.
Level 1: Spreadsheet Survival (Where 67% Start)
You know you're here when every data question starts a treasure hunt.
Excel files with names like "Fleet_Costs_FINAL_v3_Mike_Edit_UPDATED.xlsx" live on three different computers. Fuel receipts pile up in a shoebox next to your desk. Maintenance records get stuffed in glove compartments. Driver performance discussions start with "I heard that..."
Your monthly reports? You stay late, hope the numbers add up, and pray nobody asks tough questions.
Take Road Transpo in the Philippines. They run sixty-five fuel tankers, and before they got smart about data, everything lived in Excel sheets. "Complete chaos," their operations guy told me. "Every question took half a day to answer, and half the time we weren't even sure the answer was right."
The symptoms: Data questions take hours. Reports are always late. You make decisions without proof. The same problems keep happening because you can't see the patterns.
Level 2: System Overload (Where Growth Stalls)
Here's what happens when you grow fast without a plan.
You've got GPS tracking in one system. Fuel cards in another. Maintenance schedules are in a third. None of them talks to each other. To answer simple questions, you export data, open Excel, and play detective for an hour.
You can get answers, but it takes forever. And when that one person who knows where everything is goes on vacation? Good luck.
The symptoms: Basic questions take thirty to sixty minutes. Monthly reports eat entire afternoons. Decisions get delayed waiting for data. New employees spend weeks just figuring out where things are.
Most fleets with fifteen to forty trucks get stuck right here.
Level 3: Smart Operations (Where Money Gets Made)
This is where the magic happens.
Your systems actually work together. Dashboards show you what matters, when it matters. Problems get caught before they cost money. Reports generate themselves. You use data for planning, not just compliance.
Here's a perfect example. MORE d.o.o. runs a wood production company with forklifts, loaders, and trucks. Their fleet manager Dejan, used to track everything manually. "Complete nightmare," he says. "Now with just a few clicks, I have everything I need."
The symptoms: Yesterday's data drives today's decisions. Problems get fixed before they explode. Your competitive bids win because you know your real costs. Team members can find information without calling you.
Level 4: Strategic Intelligence (The Top 5%)
Data becomes part of your company culture.
You don't just track performance - you predict it. Vehicle buying decisions use historical data. Route planning considers efficiency patterns. Driver development follows performance trends. You set industry benchmarks instead of chasing them.
Quick Reality Check
Answer these without looking anything up:
- Which truck cost the most to run last month?
- Which driver improved the most over ninety days?
- How does this quarter's cost-per-mile compare to last quarter's?
- Which routes always take longer than planned?
- What maintenance problem happens most often?
Scoring: 0-1 answers = Level 1. 2-3 = Level 2. 4-5 = Level 3. All five plus trend analysis = Level 4.
Here's the thing most people get wrong: they try to jump straight from Level 1 to Level 4. That's how you end up with expensive systems nobody uses.
The smart move? Focus on better decisions, not more data.
What Changed in 2025 (And Why It Matters to You)
Look, I'm not going to bore you with every regulatory update. But there are a few changes that actually affect how you should handle fleet data.

January 2025 - Driver Privacy Rules Got Stricter. FMCSA now requires explicit consent for performance tracking. Update your driver agreements by June 1st. This isn't optional.
March 2025 - Insurance Companies Standardized Their Metrics
Big news here. The Insurance Industry published fifteen core metrics that they all use now for premium calculations. Get your reporting aligned with these, and you could save 8-12% on renewals.
July 2025 - Software Finally Started Playing Nice Major breakthrough. Platforms like Simply Fleet, Geotab, and Samsara can now share data directly. No more vendor lock-in. Switching costs dropped by 60-80%.
September 2025 - California Might Go Full Automatic: CARB is considering continuous emissions monitoring through telematics instead of periodic testing. If you run in California, start thinking about this now.
Here's the pattern I keep seeing: even fleets that operate purely within one state adopt federal standards anyway. Why? Because insurance companies, banks, and big customers expect standardized reporting regardless of what regulations technically apply to you.
My advice: Don't chase every update immediately. Batch changes quarterly. Test with a few trucks first. Your competitive edge comes from stable, reliable data, not bleeding-edge features that break your workflow.
The Five Numbers That Actually Matter
Here's where most fleet managers go wrong. They track everything their system can measure instead of focusing on what actually drives decisions.
I call this the 15-Minute Rule: Can someone new to your operation understand this metric and take action within fifteen minutes of seeing an alert?
Complex analytics belong in monthly reviews. Daily operations need dead-simple clarity.
The F.L.E.E.T. Method for Picking Metrics
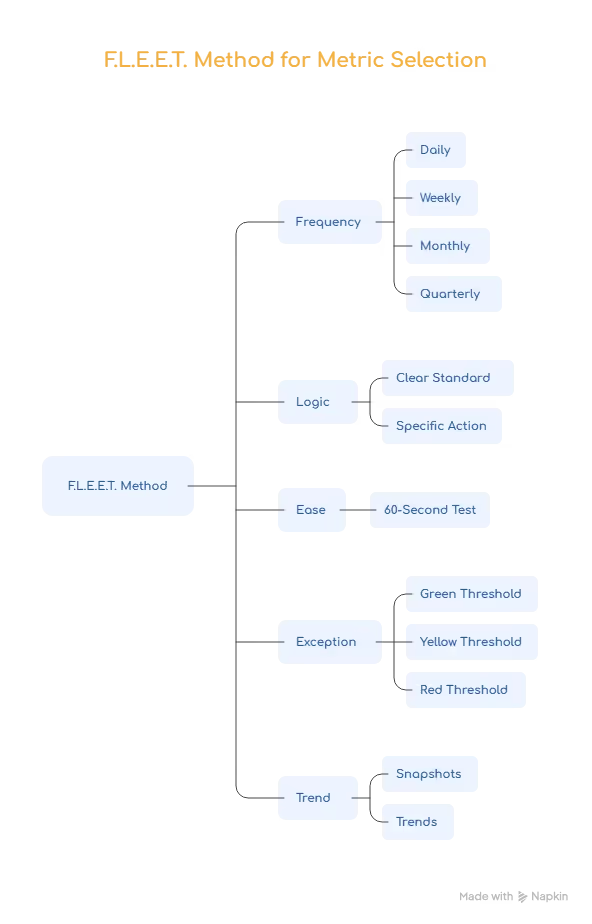
Before you add any number to your dashboard, run it through this filter:
F - Frequency: How often do you need this? Daily stuff: safety alerts, fuel problems, route issues Weekly stuff: driver trends, maintenance schedules
Monthly stuff: cost analysis, big picture metrics
L - Logic: Does this number trigger a specific action? Bad example: "Driver John's score is 847 out of 1000." (So what?) Good example: "Driver John had 3.2 hard stops per 100 miles this week, above our 2.0 limit." (Clear action needed.)
E - Ease: Can your team use this without training? Simple test: show it to someone unfamiliar with your operation. If they can't explain what to do about it in sixty seconds, simplify it or ditch it.
E - Exception: What triggers immediate action? Every metric needs clear thresholds. Green (all good), yellow (watch closely), red (fix now). Numbers without action triggers just become wallpaper.
T - Trend: Does the change over time matter? Some numbers matter right now (fuel level). Others only matter as patterns (fuel efficiency improvement).
Your Five Core Metrics
Master these before you add anything else:
1. Cost-Per-Mile Variance Track this daily or weekly. When actual costs run more than 10% over plan, investigate immediately. Over 20%? Stop dispatching that truck until you know why.
Example alert: "Truck 12 is running $0.23 over planned cost-per-mile. Check fuel efficiency, route problems, and recent maintenance."
2. Fuel Efficiency Problems
Watch for trucks running 15% below your fleet average. That usually means driver issues or mechanical problems. Drop 25% below? Get it to the shop.
Modern fleet management software handles this automatically. Good systems can scan fuel receipts with your phone camera and calculate efficiency on the spot. Some connect directly to fuel cards for real-time tracking.
3. Safety Events: Hard braking, speeding, rapid acceleration per 100 miles. More than three events per 100 miles means driver coaching time. Over five? Mandatory retraining.
Digital inspection systems catch this automatically through GPS integration. They score driver behavior in real-time and send alerts when someone crosses safety thresholds.
4. Vehicle Utilization Revenue miles divided by total miles. A utilization below 70% means you need to look at your routes. Below 60% means bigger strategic problems.
5. Maintenance Budget Reality Actual maintenance spend versus what you planned. More than 20% over budget demands an investigation. Over 40%? Start thinking about replacement.
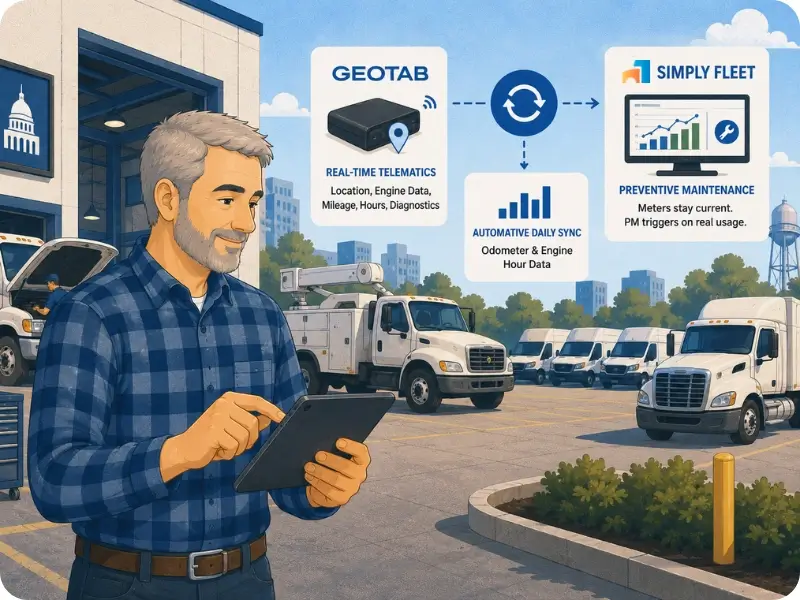
The best systems track this through integrated work orders and parts management. They schedule maintenance based on miles, time, or engine hours - whatever makes sense for each truck.
Keep It Simple: Display these five metrics with clear green/yellow/red indicators. Let people drill down to details, but keep the main dashboard simple enough for hallway decisions.
I see fleets add twenty metrics because their system can track them. Don't fall into that trap. Stick with these five for ninety days. You'll be amazed at how much improvement comes from obsessing over the basics.
The D.A.T.A. Stack (Not What You Think)
Forget the usual "buy hardware, install software, hope it works" approach.
Smart fleets use the D.A.T.A. method: Define decisions first, then find technology to support them. This prevents expensive system installations that nobody ends up using.
D - Define the Decision
Start with the choices you need to make better or faster:
Daily stuff: Which truck goes on which route? Do route delays justify calling the customer? Which maintenance issues need immediate attention?
Weekly planning: Which drivers need coaching? Are fuel patterns suggesting route problems? Which trucks need maintenance soon?
Monthly strategy: Should route profitability justify price increases? Which trucks are approaching replacement time? Are training programs actually working?
Big decisions: Should you expand the fleet? Which technology investments actually pay off? Can operational improvements win you more competitive bids?
A - Acquire Minimum Viable Data
Most fleets collect way too much information and then ignore most of it. Start basic:
Essential data sources:
- Where trucks are and how many miles (basic GPS)
- Fuel consumption and costs (fuel card integration)
- Basic maintenance records (digital work orders)
- Driver behavior basics (speeding, hard stops)
- Route performance (planned versus actual time and miles)
Nice-to-have data (add only after mastering the essentials):
- Detailed engine diagnostics
- Advanced driver analytics
- Weather and traffic correlation
- Customer satisfaction tracking
- Competitive benchmarking
The 3-Month Rule: Only implement data collection you promise to review and act on monthly for at least three months. Unused data just becomes system overhead.
T - Test with a Small Sample
Before going fleet-wide, prove that better data actually improves decisions using three to five trucks as a pilot.
Week 1-2: Measure baseline with current decision process. Week 3-6: Add data collection and daily review
Week 7-8: Compare outcomes and improvements. Week 9: Document lessons and plan rollout
Success looks like: 50% faster decision-making, measurable performance improvements, daily system usage without nagging, and a clear ROI path.
A - Automate Only After Proving Value
Biggest mistake small fleets make? Automating data collection before proving they'll actually use the insights.
Manual processes that work beat automated systems that get ignored every time.
Smart sequence:
- Manual collection (1-2 months): Proves data value, builds review habits
- Semi-automated collection (2-3 months): Reduces busy work while maintaining engagement
- Full automation (month 4+): Only after proving sustainable improvement
Pro tip: Skip pretty dashboards. Create simple alerts that trigger specific actions:
- "Truck 15 used 20% more fuel yesterday. Check route and driver."
- "Driver Johnson shows 15% safety improvement. Schedule recognition meeting."
- "Route 7B utilization dropped to 58%. Analyze consolidation opportunities."
Action-oriented alerts beat pretty charts because they connect information directly to decisions.
Getting Started: The 30-Day Challenge
Most technology rollouts fail because they try to fix everything at once.
Here's the contrarian approach that actually works: start with your worst-performing truck, not your best one. Maximum improvement potential proves value fast.
Week 1: Pick Your Problem Child
Choose the truck with the highest fuel costs, most maintenance headaches, or worst utilization. Install basic tracking. Document thirty days of baseline performance for comparison.
Here's the sneaky part: assign your most skeptical driver to this truck. Convert the doubter first.
Days 2-7: Track only fuel efficiency daily. Make one change based on what you learn - route tweak, driver coaching, maintenance check. Document any improvement.
Day 7: Share the week's results with that driver. Ask for their input. Build buy-in through collaboration, not surveillance.
Shaun K., an operations manager with nineteen years in trucking, puts it perfectly: "Simply Fleet is the ONLY software I've found that's user-friendly, adaptable to operations, and cost-effective." The keyword there? User-friendly.
Week 2: Add Safety Tracking
Introduce hard braking and speeding alerts for your pilot truck. Focus on positive reinforcement for improvements. Track how fuel efficiency and safety connect.
Week 3: Show Leadership the Numbers
Present simple before/after comparisons showing measurable improvements. Calculate potential fleet-wide impact. Request approval for the three-truck expansion based on demonstrated value.
Present realistic timelines and budgets, not vendor promises.
Week 4: Test Knowledge Transfer
Train a different manager to review the data. Make sure insights work across management styles and shifts. Document what training actually needs to cover.
Day 30: Decision Time
Measure real improvement against actual investment. Calculate ROI for full fleet deployment based on pilot results, not industry averages.
Real example: 18-truck delivery fleet
- Pilot truck baseline: $847 monthly fuel
- Post-data: $734 monthly fuel
- Improvement: $113/month per truck (13.3% reduction)
- Annual fleet savings: $113 × 18 × 12 = $24,444
- Technology cost: $45/month × 18 = $9,720 annually
- Net ROI: $14,724 first year
Industry data backs this up. Small fleets using good fleet management software typically see 60% less unplanned downtime, 20% maintenance savings, and teams working five times faster on daily tasks.
The pilot approach works because it proves value with minimal risk while building organizational skills step by step.
Download Our Free Fleet Maintenance Resources Now!
Prevent costly breakdowns and maximize uptime with our free checklist.
Download
Choosing the Right Software (Anti-Vendor Guide)
Pick technology based on what your pilot program proved you need, not what vendors say you should want.
The best system is the one your team actually uses every day to make better decisions.
Three Budget Tiers That Actually Make Sense
Small Fleets (5-25 trucks): $30-50 per truck monthly
- Basic GPS with location and mileage
- Fuel card integration for automatic cost tracking
- Simple driver behavior monitoring
- Mobile app for driver inspections
- Monthly reports with your five core metrics
Cost-effective options start at $2 per vehicle monthly with comprehensive features including digital inspections, basic maintenance scheduling, fuel management with receipt scanning, and work order management.
Growing Fleets (25-100 trucks): $50-80 per truck monthly
- Route optimization with traffic integration
- Full maintenance management with work orders
- Driver coaching with performance trends
- Automated reporting with custom dashboards
- Connections to accounting and dispatch systems
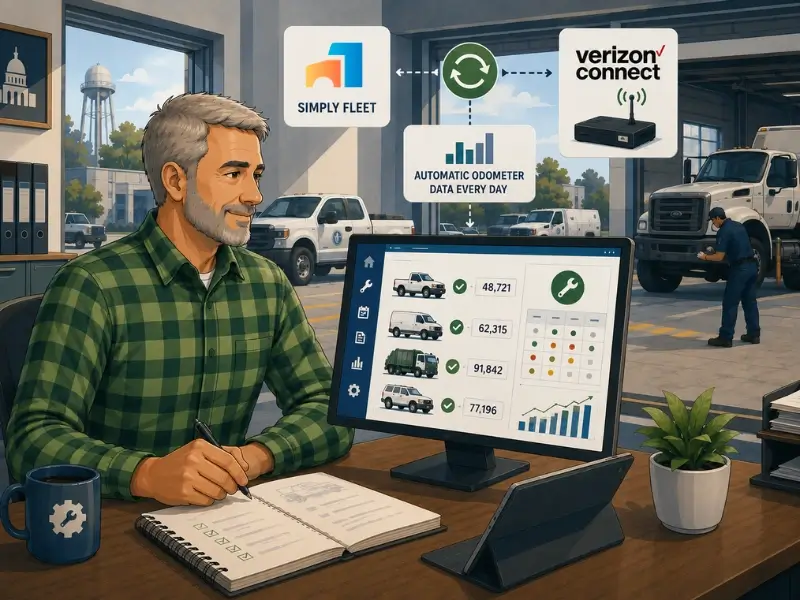
Advanced platforms at $4 per vehicle monthly add complete work order management, parts inventory with barcode scanning, integration with major telematics providers (Geotab, Samsara, Verizon Connect), and unlimited users.
Large Operations (100+ trucks): $80-120+ per truck monthly
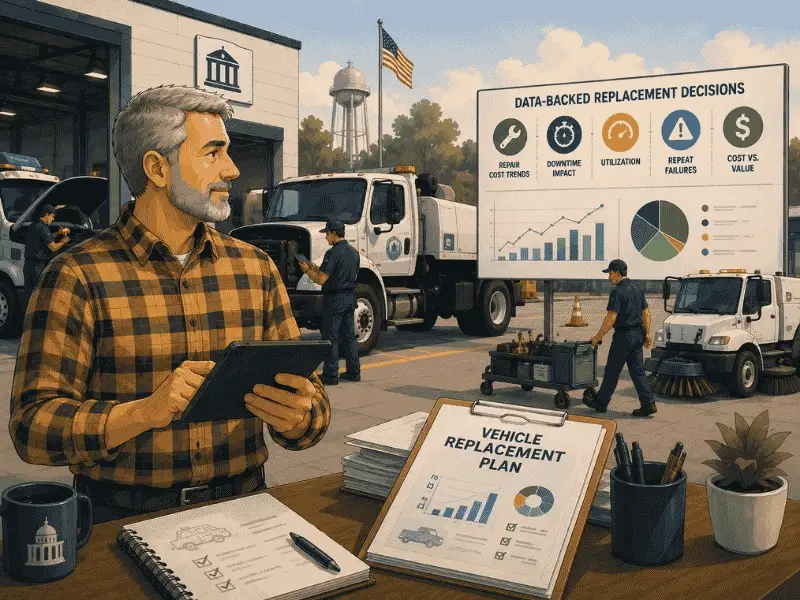
- Predictive analytics for maintenance and replacement planning
- Advanced safety with video monitoring
- Industry benchmarking
- Custom reporting and business intelligence
- Full integration with ERP and accounting systems
The 15-Minute Demo Test
Ask every vendor to show you these three scenarios:
- "Driver reports truck problem at 2 PM. Walk me through work order creation, repair scheduling, dispatch notification."
- "Fuel costs exceeded budget 18% last month. Show me how to find causes and track improvement."
- "Insurance wants six months of safety data. Generate the report."
If any demo takes more than fifteen minutes per scenario, the system is too complex for daily operations.
What to Look For
Ease of use (40% of decision): Will your team actually use this daily? Integration ability (25%): Does it connect cleanly with existing systems? Support quality (20%): Can you get help when things break? Feature fit (10%): Does it solve your specific problems? Price (5%): Cost matters less than adoption and results
Free trial strategy: Look for genuine free plans for small fleets instead of just time-limited trials. This lets you evaluate without pressure and shows vendor confidence.
Falls City School District's transportation director uses their system "daily, multiple times per day" and calls it "simply the best." That's the adoption level you're aiming for.
Making Data Work with People
The biggest barrier to fleet data success isn't technical - it's cultural.
Drivers think you're spying. Managers think you're questioning their experience. Owners think you're wasting money. Address these concerns head-on or your system will fail.
Converting the Skeptics
Drivers: "This is just Big Brother watching me." Reality check: Good data proves good driver performance and catches unfair route assignments.
Start with positive recognition. Share weekly highlights of data-proven achievements before introducing any coaching. "Driver spotlight" reports work better than performance warnings.
Managers: "I've run this operation for fifteen years on gut instinct."
Reality check: Data validates good instincts and reveals blind spots that experience might miss.
Position data as confirmation of expertise, not replacement. "You were right about Route 7 being inefficient - here's the proof."
Owners: "We can't afford expensive technology with uncertain returns." Reality check: Small fleets often waste more money on uninformed decisions than on technology costs.
Frame systems as insurance against costly mistakes, not optional efficiency tools. Calculate the cost of one breakdown, insurance claim, or lost customer versus annual technology investment.
Building Trust Through Transparency
Set clear standards: Publish exactly how metrics are used for decisions. Performance thresholds are applied consistently. Improvement recognition is emphasized over problem identification.
Collaborative problem solving: "Numbers show fuel efficiency dropped 12% last month. What's your experience? What should we investigate?"
Involve drivers in interpreting metrics and developing solutions. Share team performance to build accountability without individual blame.
The most successful rollouts focus on simplicity. One customer described their training: "We sent a text telling drivers to download the app, go to fuel tracking, and hit the plus button. Self-explanatory after that."
When Data Conflicts with Judgment
Real scenarios where numbers disagree with experience:
Scenario: Data says fire Driver Johnson (safety violations), but he's been with you eight years and supports a family. Approach: Use data to diagnose specific problems, human judgment to design solutions. Try intensive retraining with measurable improvement targets and a timeline. If no data improvement after ninety days, help him find work better suited to his skills.
Scenario: Route 15A shows consistent losses, but serves your biggest customer.
Approach: Use cost-per-mile analysis to justify pricing discussions or route optimization. Maintain a relationship while using data to negotiate fair compensation.
The principle: Data identifies what deserves attention. Human wisdom determines appropriate action.
Measuring Real Success
Track results through operational improvements and competitive advantages that compound over time.
Benefits That Build on Each Other
Year 1: 8-15% fuel savings through route optimization and driver coaching. 12-20% maintenance cost reduction through better scheduling. 60-80% less time on reports and data hunting.
Years 2-3: Better customer service through route monitoring. Competitive bids that win because you know real costs. Driver retention through fair, data-based evaluation. Strategic planning based on historical performance.
Years 4+: Market differentiation through superior efficiency. Optimal vehicle replacement timing. Organization-wide data literacy improving all decisions. Industry leadership position.
Your Monthly Scorecard
Cost Management:
□ Fuel cost per mile: _____ (Target: 5% improvement year over year)
□ Maintenance cost per mile: _____ (Target: under $0.12)
□ Total cost per mile: _____ (Target: 10% below industry average)
Efficiency:
□ Vehicle utilization: _____ (Target: over 75% revenue miles)
□ On-time delivery: _____ (Target: over 95%)
□ Route efficiency: _____ (Target: under 105% planned miles)
Safety:
□ Accidents per million miles: _____ (Target: under 2.0)
□ Hard braking per 100 miles: _____ (Target: under 3.0)
□ Speed violations: _____ (Target: under 2% of drive time)
Success Stories That Prove It Works
The Route That Paid for Everything: Route 12B looked profitable until data revealed 23% deadhead miles returning to the depot. Optimization cut total miles 18%, saving $15,600 annually - covering technology costs for the entire fleet.
The Driver Turnaround: Maria's safety scores improved 34% over six months through targeted coaching based on specific insights. She went from high-risk to training other drivers, and fuel efficiency improvements saved $2,400 annually.
The Breakdown Prevention: Truck 18's engine data predicted DPF problems three weeks early. Proactive cleaning costs $340 versus an estimated $4,200 for roadside repair and towing.
Real customers validate these patterns. Dejan from MORE d.o.o. says: "Before fleet management software, managing vehicles was a manual nightmare. Now with just a few clicks, I have everything I need."
Your Next Step
The technology exists for every fleet size and budget. Whether you're managing five trucks or five hundred, start with systems matching current needs while allowing room to grow.
Start Smart, Scale Up
Small fleets (5-25 trucks): Modern solutions offer comprehensive features starting at $2 per vehicle monthly. Look for digital inspections, basic maintenance scheduling, fuel management with receipt scanning, work orders, and mobile apps requiring minimal training.
Growing fleets (25-100 trucks): Advanced platforms at $4 per vehicle monthly add complete work order management, parts inventory with barcode scanning, major telematics integration, unlimited users, and comprehensive reporting.
Large operations (100+ trucks): Custom enterprise solutions provide API integrations, predictive analytics, advanced safety programs, industry benchmarking, and dedicated support.
Implementation That Actually Works
Start free when possible: Many platforms offer permanent free plans for small fleets (typically up to five vehicles), allowing thorough evaluation without time pressure.
Pilot before scaling: Test with three to five trucks for thirty days before full deployment. Proves value while identifying challenges and training needs.
Focus on adoption: Choose systems your team will use daily. Feature-rich platforms fail if people find workarounds.
Plan for growth: Select systems scaling from small operations to enterprise needs without complete changes as you expand.
Making the Business Case
Present investment using concrete ROI projections:
Cost reductions: 8-15% fuel efficiency improvement, 60% less unplanned downtime, 20% maintenance savings, 60-80% less administrative time.
Risk mitigation: Reduced insurance premiums through safety programs, audit-ready compliance documentation, prevented roadside failures, and fair driver management.
Competitive advantages: Data-supported pricing for bids, superior on-time performance, professional customer reporting, and operational efficiency enabling growth without proportional cost increases.
The Bottom Line
Remember Mike and his wall of pretty charts nobody used?
Six months later, his office looks completely different. One monitor shows five key metrics with clear green/yellow/red indicators. He's on the phone with his insurance company, pulling up twelve months of safety improvements in real-time.
"Hard braking events down 31%, speeding violations down 47%, four major maintenance issues prevented through predictive alerts," he tells them confidently. The premium reduction they're discussing will cover his technology investment twice over.
You can make the same transformation. Trade decorative data for decisive intelligence. Metrics chosen for decisions they drive, not impressiveness. Systems eliminate busy work instead of creating more. Reports triggering action rather than filing cabinet storage.
2025's fleet landscape - regulatory reporting, insurance requirements, competitive pressures - no longer creates chaos because you have systematic processes with clear owners and reliable outcomes.
Whether you start with a free plan for five trucks or implement comprehensive software across hundreds of vehicles, transformation begins with one decision: choosing systematic intelligence over operational guesswork.
Look, managing a fleet is hard enough without flying blind. Your drivers will thank you. Your accountant will thank you. And six months from now, when the next insurance audit takes fifteen minutes instead of fifteen hours, you'll thank yourself.
Try Simply Fleet free today - no credit card required, no time limits for small fleets, no complicated setup. Because data-driven beats dart-throwing every single time.
Time to get started.