





Preventive Maintenance Checklist for Excavators: What to Check and When
Key Takeaways
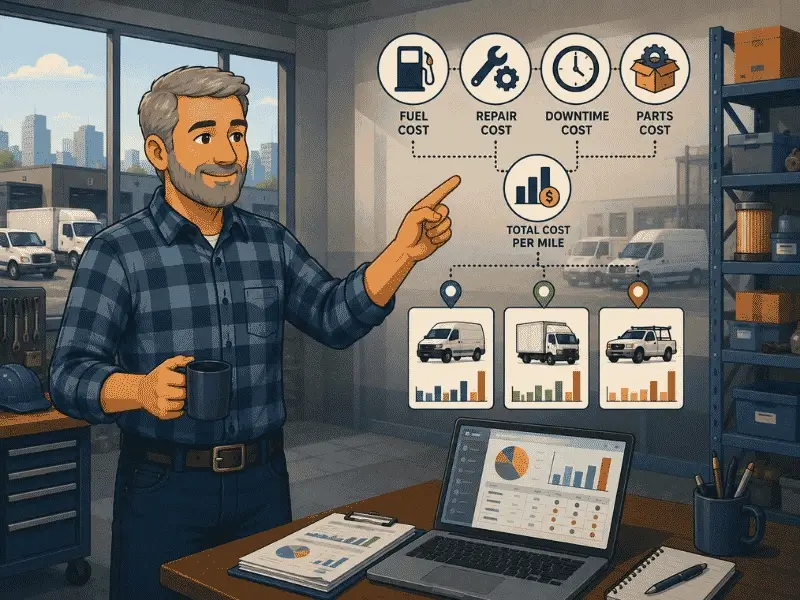
• A high-cost vehicle is a total cost problem, not a purchase price problem: fuel, repairs, downtime, and parts all count toward the number that matters.
• Multi-location fleets lose visibility at the handoff between sites: costs get logged locally and never compared against the rest of the fleet.
• Cost per mile and cost per vehicle are the two metrics worth tracking first: they normalize spend so you can compare a van in one city against a van in another.
• Grouping vehicles by location and running a vehicle-level expense report: surfaces which assets are outliers, without needing a data team.
• Once you find a high-cost vehicle, the decision is repair, reassign, or retire: and the right call depends on how the cost compares to the rest of its group, not just its own history.
Fleets that operate out of one yard can usually spot a problem vehicle by instinct. The mechanic knows it, the dispatcher knows it, everyone has a story about the truck that is always in the shop. Spread that same fleet across three, five, or ten locations, and the instinct disappears. Each site manager knows their own vehicles. Almost nobody has the full picture.
That gap gets expensive fast. A vehicle that costs 40% more to run than its peers does not announce itself. It shows up as a slightly higher fuel bill here, a slightly longer repair here, and a bit more downtime over there, none of it dramatic enough to flag on its own. Add it up across a year, though, and it is often one of the largest line items nobody has actually looked at.
This guide walks through what actually makes a vehicle high-cost, why multi-location fleets are especially prone to missing it, and the specific steps to surface these outliers using data you likely already have in Simply Fleet.
What Counts as a High-Cost Vehicle
Purchase price is the easiest number to point to, and the least useful one for this exercise. A vehicle's true cost is everything it takes to keep it running and productive over its life. That includes:
• Fuel and mileage: how much it burns relative to how much work it actually does.
• Repairs and parts: not just the big failures, but the steady drip of smaller fixes.
• Downtime: days a vehicle sits idle waiting on service or parts are days it is not earning its keep.
• Frequency of service: a vehicle that needs attention every few weeks is telling you something a full-year total won't.
For a deeper look at how these add up over a vehicle's life, see our guide on calculating total cost of ownership for your fleet, and the total cost of ownership glossary entry for the short definition.
Why Multi-Location Fleets Lose Track of Cost
Every location has its own reasons for running a little hotter or a little cheaper. Weather wears down brakes faster in one region. Local labor rates push repair invoices higher in another. A single site manager might quietly favor a vendor who overcharges, simply because nobody is comparing that vendor's invoices against the rest of the company.
None of that is unusual. What is unusual is how rarely it gets caught, because the data sits in different notebooks, different spreadsheets, or different heads. We hear a version of this constantly from operators managing fleets across more than one site. A pool cleaning operation running 20 to 25 vehicles in one region, with a second set managed separately by a family member in another, put it simply: everything was sitting in a Google Sheet with no shared visibility between the two.
Construction operators managing large, mixed fleets describe the same gap from a different angle. One operator running 300 to 400 trucks, trailers, and equipment across an active, growing business needed to track maintenance costs, run inspections, manage inventory, and see what was actually going into each piece of equipment, not just the fleet as a whole. That last part is the piece multi-location fleets tend to lose first: cost by asset, not just cost by company.
The Metrics Worth Watching First
You do not need a data science team to start finding outliers. Two numbers do most of the work:
• Cost per vehicle: total spend (fuel, repairs, parts) divided across each asset, so you can rank vehicles against each other rather than judging each one in isolation.
• Cost per mile: cost normalized against how much a vehicle actually drives, which matters because a high-mileage vehicle should cost more in absolute terms, but not necessarily more per mile.
Our cost per mile glossary page breaks down the formula if you want the exact calculation. Once you have both numbers, downtime is worth tracking as a third signal. A vehicle with average costs but well-above-average downtime is still a high-cost vehicle, the cost is just showing up as lost productivity instead of an invoice.
Download Our Free Fleet Maintenance Resources Now!
Prevent costly breakdowns and maximize uptime with our free checklist.
Download
Finding the Outliers in Simply Fleet
This is where the metrics turn into an actual list of vehicles to look at. The process is the same whether you run 3 locations or 30.
1. Group vehicles by location or business unit
Start by organizing your fleet the way your business actually operates, by location, department, or type, using vehicle grouping. This is what lets you compare a delivery van in one region against a delivery van in another, instead of lumping every vehicle into one undifferentiated list. See our guide on managing a multi-location fleet for how operators structure this in practice.
2. Pull an expense-by-vehicle view
Simply Fleet's expense management tools log fuel, tolls, repairs, and permits in one place and categorize them by vehicle, so you are not manually reconciling five separate spreadsheets to get a single number per asset. Our guide to tracking spend by vehicle and asset walks through setting this view up.
3. Build a custom report and sort by cost
Simply Fleet's reporting and data analysis tools let you build a custom report using natural language, ask something like which vehicles cost the most to maintain this quarter, and get a ranked answer instead of building a pivot table from scratch. Save the report so you can pull the same view again next month. Our fleet reporting metrics guide has more on which metrics are worth turning into a saved report.
4. Bring telematics data in if you already have it
If any of your locations already run Geotab or Samsara, connecting that integration syncs mileage and vehicle data directly into Simply Fleet rather than requiring manual entry at each site. See our post on minimizing downtime with Geotab and Samsara integration for how that connection works.
The fleets that catch this early aren't the ones with the fanciest dashboard. They're the ones where someone actually looks at cost per vehicle on a regular cadence, not just at renewal time or when a truck finally breaks down for good. On paper, a lot of multi-location fleets look organized: everyone has their own spreadsheet, their own process. In practice, tidy local paperwork and an efficient fleet are not the same thing. The question worth asking isn't whether each site is documenting things well. It's whether anyone is comparing what one site is spending against what another is spending for the exact same job.
What the Demos Tell Us About Cost Visibility
This gap shows up constantly in conversations with fleet operators. Across a broad set of recent product demos, the moment that consistently drew the strongest reaction was not a dashboard or a chart. It was asking a plain question, something like show me my top five most expensive vehicles to maintain, and getting an immediate, ranked answer. That single query touched the majority of demo conversations we ran this year, which says less about the feature itself and more about how rarely fleet operators have had an easy way to ask that question at all.
It makes sense. Most fleet spreadsheets are built to record what happened, not to answer a question about which vehicle is the problem. Turning a year of scattered entries into a ranked list normally means exporting data, cleaning it up, and building a pivot table by hand, exactly the kind of task that gets pushed to next quarter and then never happens.
Once You've Found a High-Cost Vehicle
Finding the outlier is only half the job. The decision from there usually falls into one of three buckets.
• Repair, if the cost is a one-off spike: a single major repair does not necessarily mean a vehicle should go. Compare it against its group average over a full year before deciding.
• Reassign, if the vehicle is fine but the location isn't: sometimes a vehicle is expensive because it's doing a job it isn't suited for, not because it's failing. Moving it to a lower-demand route or location can fix the number without any repair work at all.
• Retire, if the cost keeps climbing across multiple periods: a vehicle whose cost per mile keeps rising quarter over quarter, relative to its group, is telling you something a single repair bill can't.
Our guides on repair versus replace decisions for heavy equipment and planning for vehicle replacement go deeper on how to weigh that decision once you have the cost data in front of you. And if the number that surprised you was a maintenance cost you didn't expect, our piece on hidden fleet maintenance costs covers the categories that tend to hide in plain sight.
Adoption is the part people underestimate here. It doesn't matter how good a cost report is if only one person at headquarters ever opens it. The fleets that actually act on this data are the ones where the site-level manager can see their own vehicles' costs too, not just a regional director looking down from above. Give the person closest to the vehicle a reason to look at the number, and the outlier gets caught a lot sooner than if it only shows up in a quarterly review nobody reads until it's too late.
Ready to see your own high-cost vehicles?
Group your fleet by location, pull a cost-by-vehicle report, and see which assets are actually worth a closer look. Book a demo or explore Simply Fleet's fleet management features.
Follow Simply Fleet on LinkedIn for product updates and fleet management insights.